Descriptive and Visual Missing Value Assessment
Source:R/missing_values.R, R/outliers.R
missing_values.RdProvides descriptive statistics and visualizations of missing values in a dataframe.
Arguments
- data
Dataframe containing the variables to be analyzed.
- color
Character string indicating the color for missing values. Default: "#79E1BE"
- all
Logical parameter that shows all variables including those without missing values. Default: FALSE.
- x
An object of class "outliers".
- ...
Further arguments passed to or from other methods.
Examples
# Clinical dataset with missing values
clinical_df <- clinical_data(dropout = 0.1, missing = 0.05)
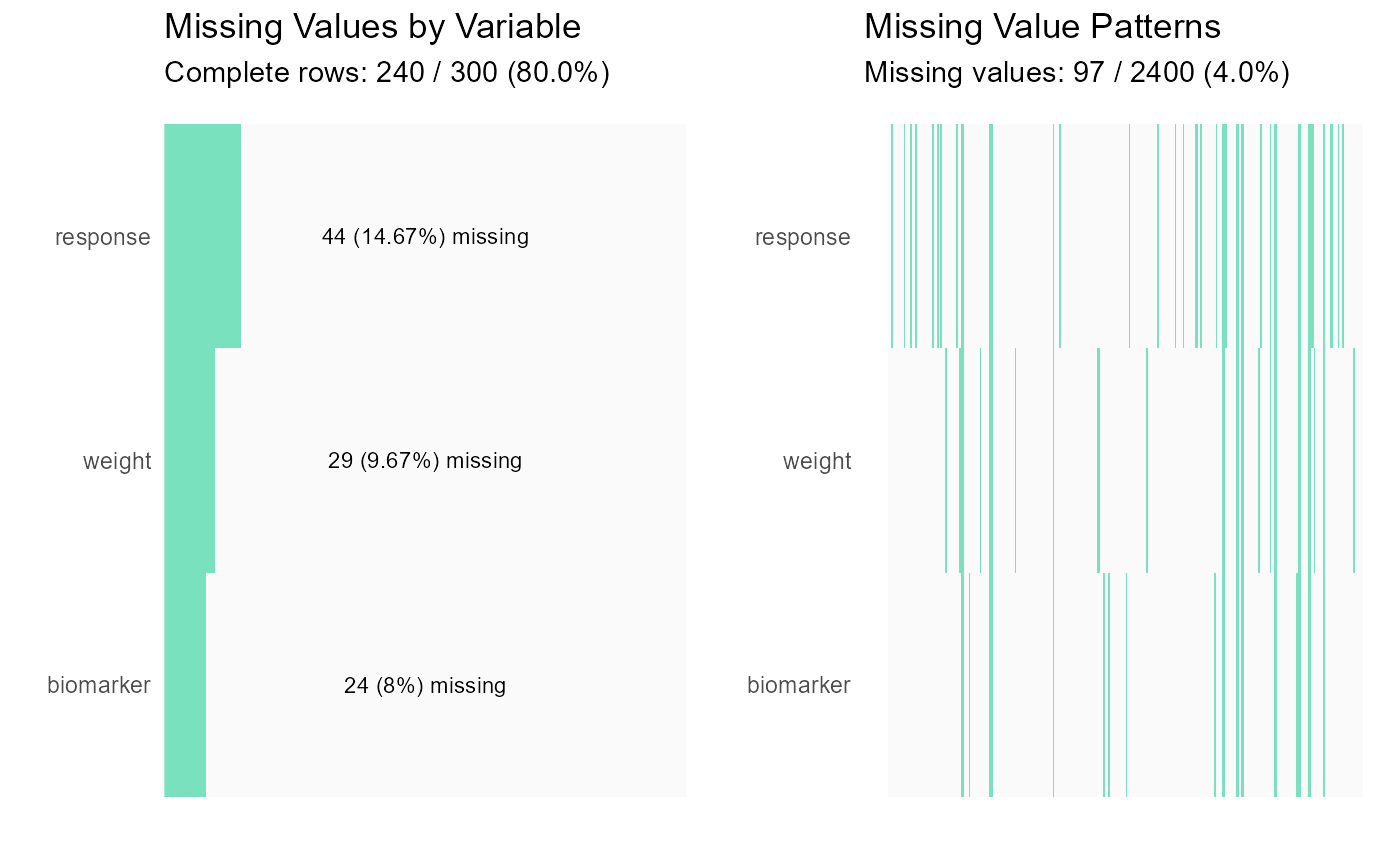
# Missing value analysis of only variables with missing values
missing_values(clinical_df)
#>
#> Missing Value Analysis
#>
#> Complete rows: 240 (80.0%)
#> Missing cells: 97 (4.0%)
#>
#> n_missing pct_missing
#> response 44 14.67
#> weight 29 9.67
#> biomarker 24 8.00
#>
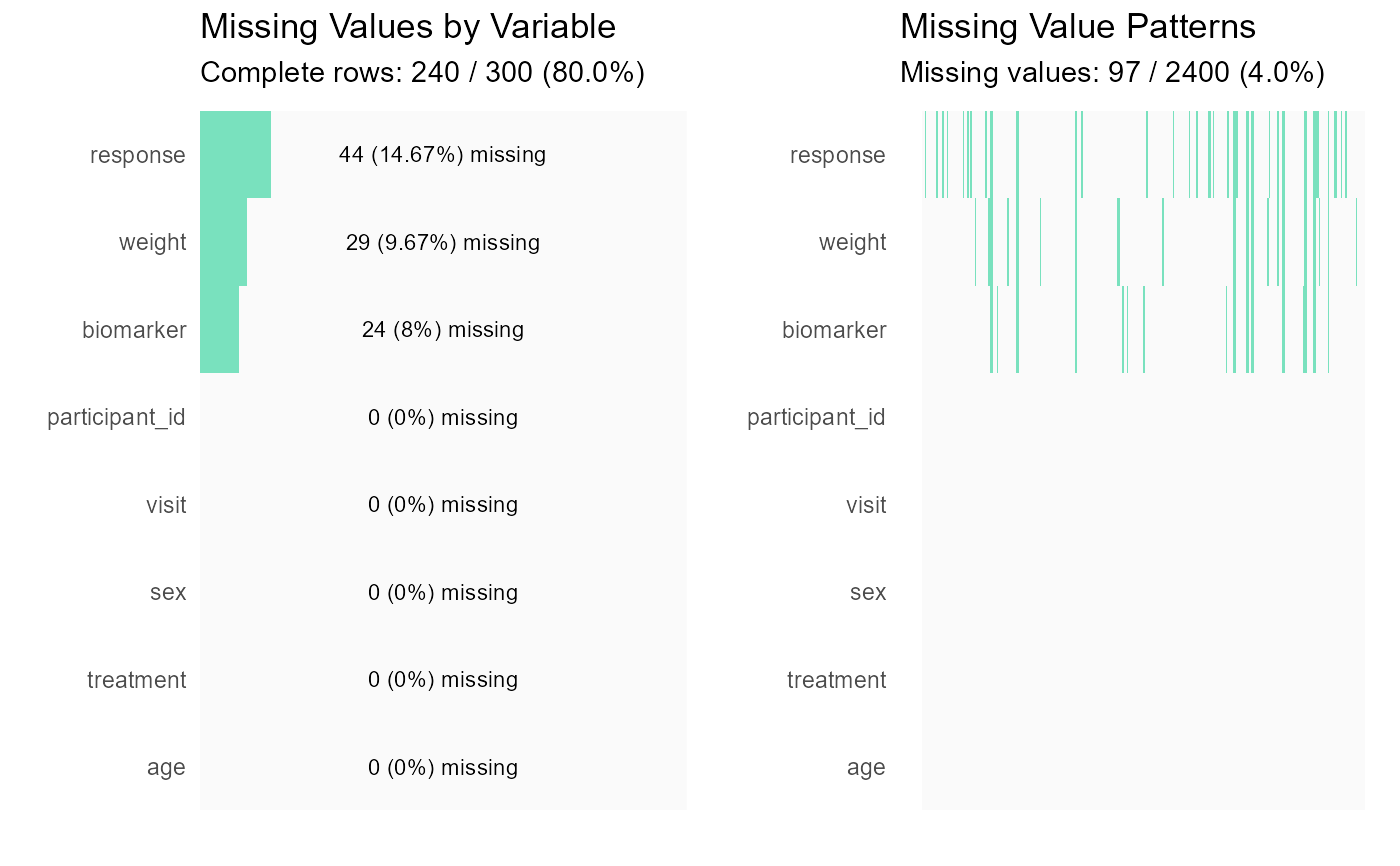
 # Show all variables including those without missing values
missing_values(clinical_df, all = TRUE)
#>
#> Missing Value Analysis
#>
#> Complete rows: 240 (80.0%)
#> Missing cells: 97 (4.0%)
#>
#> n_missing pct_missing
#> response 44 14.67
#> weight 29 9.67
#> biomarker 24 8.00
#> participant_id 0 0.00
#> visit 0 0.00
#> sex 0 0.00
#> treatment 0 0.00
#> age 0 0.00
#>
# Show all variables including those without missing values
missing_values(clinical_df, all = TRUE)
#>
#> Missing Value Analysis
#>
#> Complete rows: 240 (80.0%)
#> Missing cells: 97 (4.0%)
#>
#> n_missing pct_missing
#> response 44 14.67
#> weight 29 9.67
#> biomarker 24 8.00
#> participant_id 0 0.00
#> visit 0 0.00
#> sex 0 0.00
#> treatment 0 0.00
#> age 0 0.00
#>