Identifies outliers using Tukey's interquartile range (IQR) method and provides descriptive statistics and visualizations for outlier assessment in numeric data.
Examples
# Simulated clinical data
clinical_df <- clinical_data()
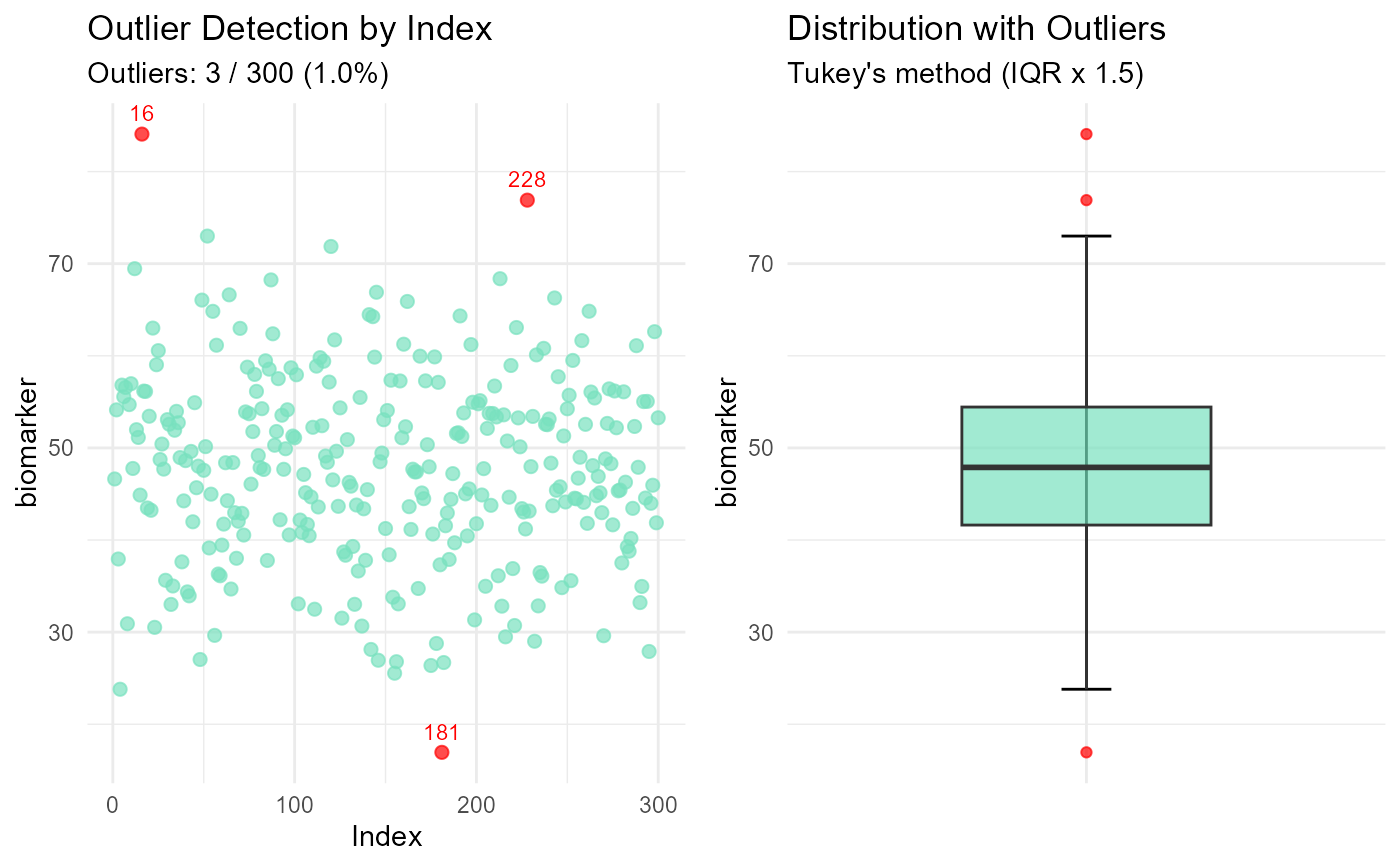
# Basic outlier detection
outliers(clinical_df, "biomarker")
#>
#> Outlier Analysis
#>
#> Variable: 'biomarker'
#> n: 300
#> Missing: 0 (0.0%)
#> Method: Tukey's IQR x 1.5
#> Bounds: [22.406, 73.656]
#> Outliers detected: 3 (1.0%)
#>
#> Outlier indices: 16, 181, 228
#>
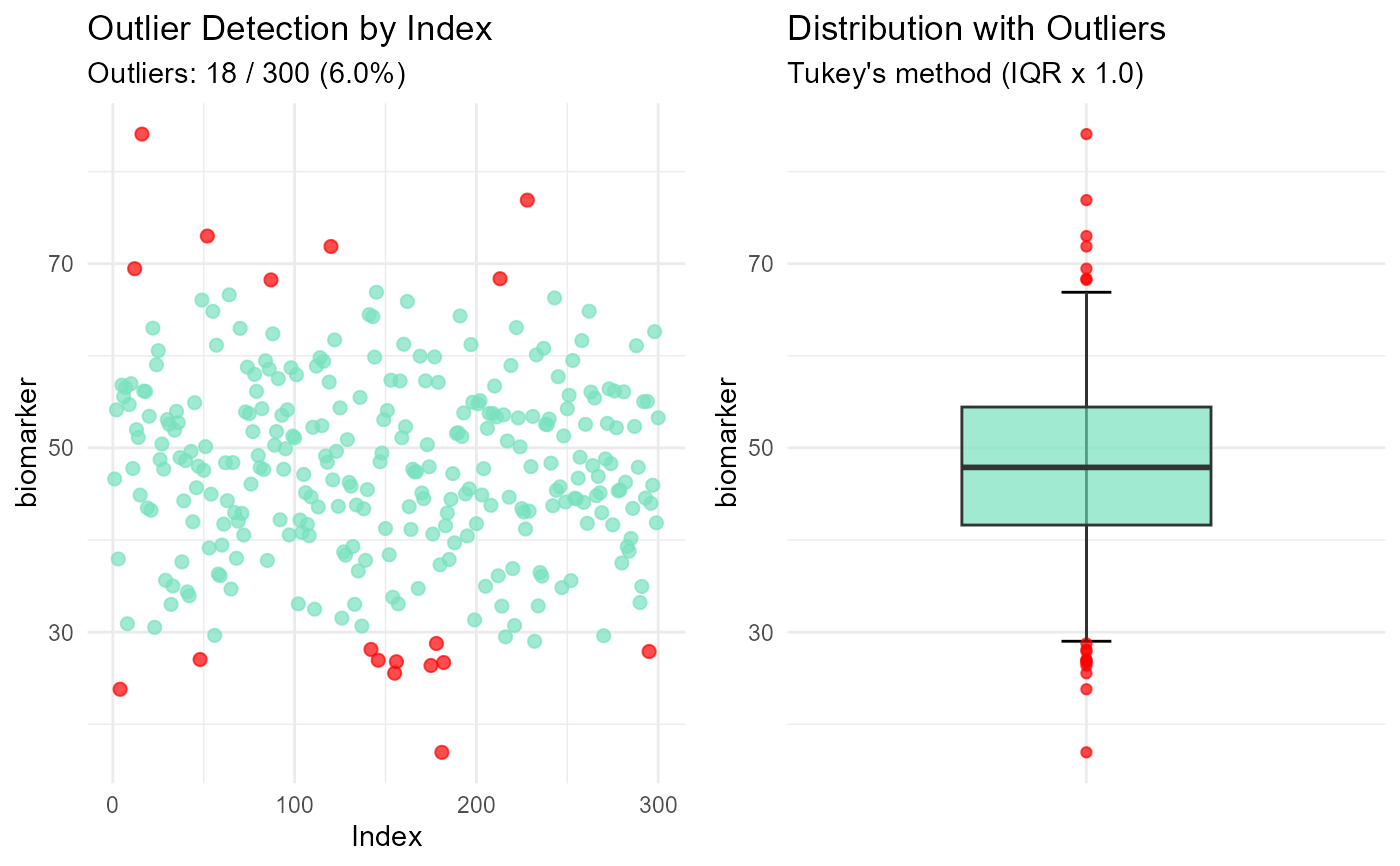
 # Using custom threshold
outliers(clinical_df, "biomarker", threshold = 1.0)
#>
#> Outlier Analysis
#>
#> Variable: 'biomarker'
#> n: 300
#> Missing: 0 (0.0%)
#> Method: Tukey's IQR x 1.0
#> Bounds: [28.812, 67.250]
#> Outliers detected: 18 (6.0%)
#>
#> Outlier indices: 4, 12, 16, 48, 52, 87, 120, 142, 146, 155, 156, 175, 178, 181, 182, 213, 228, 295
#>
# Using custom threshold
outliers(clinical_df, "biomarker", threshold = 1.0)
#>
#> Outlier Analysis
#>
#> Variable: 'biomarker'
#> n: 300
#> Missing: 0 (0.0%)
#> Method: Tukey's IQR x 1.0
#> Bounds: [28.812, 67.250]
#> Outliers detected: 18 (6.0%)
#>
#> Outlier indices: 4, 12, 16, 48, 52, 87, 120, 142, 146, 155, 156, 175, 178, 181, 182, 213, 228, 295
#>