Generates publication-ready bar plots with minimal code using ggplot2.
Usage
plot_bar(
  data,
  x,
  y = NULL,
  group = NULL,
  facet = NULL,
  position = c("dodge", "stack", "fill"),
  stat = NULL,
  colors = NULL,
  title = NULL,
  xlab = NULL,
  ylab = NULL,
  legend_title = NULL,
  flip = FALSE,
  values = FALSE
)
Arguments
- data
A data frame containing the variables to plot
- x
Character string specifying the x-axis variable.
- y
Character string specifying the y-axis variable. If NULL, counts calculated automatically. Default: NULL.
- group
Character string specifying the grouping variable for fill color. Default: NULL.
- facet
Character string specifying the faceting variable. Default: NULL.
- position
Character string specifying bar position: "dodge", "stack", or "fill".
- stat
Character string for statistical aggregation: "mean" or "median".
- colors
Character vector of colors. If NULL, uses TealGrn palette. Default: NULL.
- title
Character string for plot title. Default: NULL.
- xlab
Character string for x-axis label. Default: NULL.
- ylab
Character string for y-axis label. Default: NULL.
- legend_title
Character string for legend title. Default: NULL.
- flip
Logical parameter indicating whether to flip coordinates. Default: FALSE.
- values
Logical parameter indicating whether to display value labels above bars. Default: FALSE.
Examples
# Simulated clinical data
clinical_df <- clinical_data()
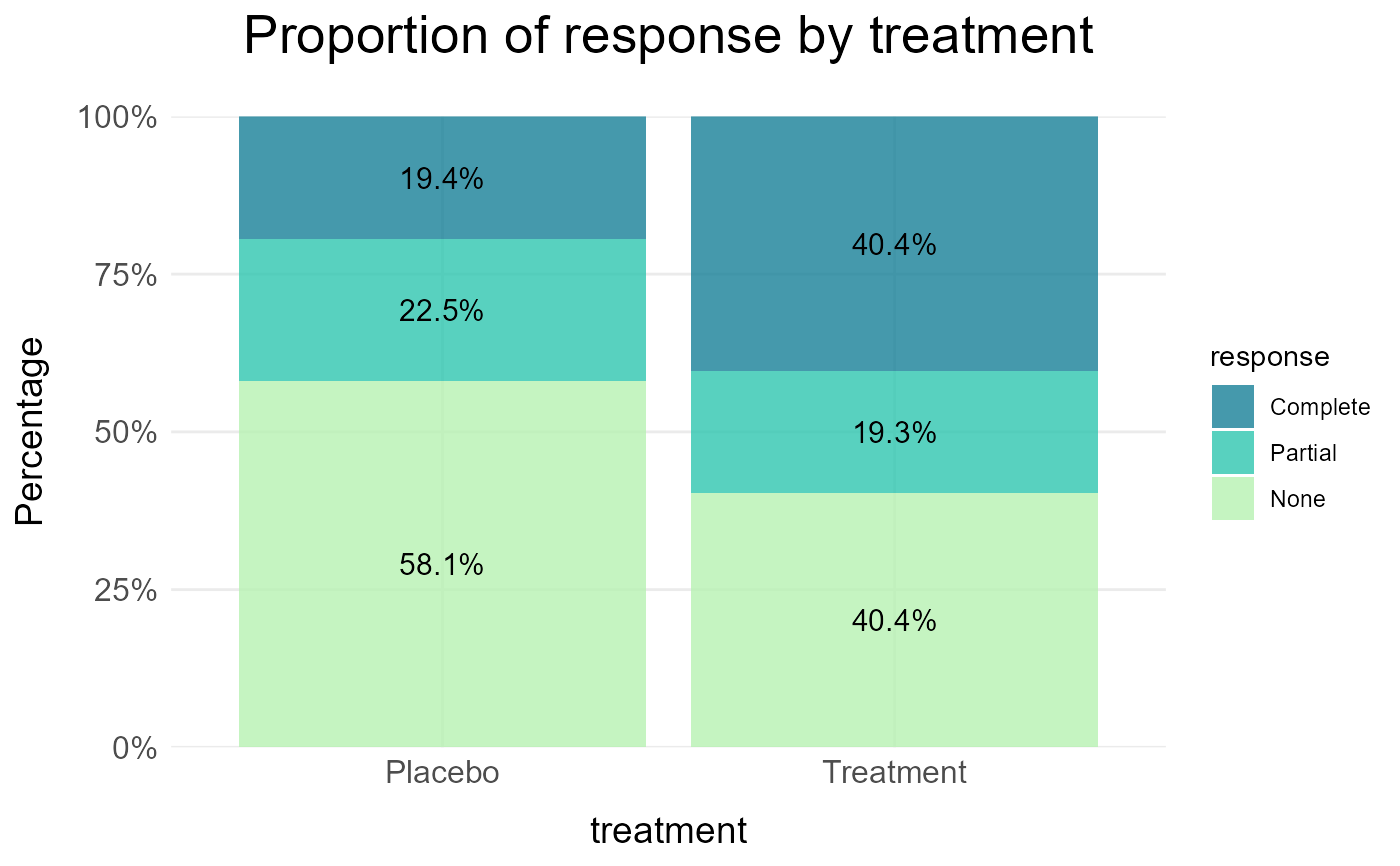
# Proportion of response by treatment
plot_bar(data = clinical_df, x = "treatment", group = "response", position = "fill",
title = "Proportion of response by treatment", values = TRUE)
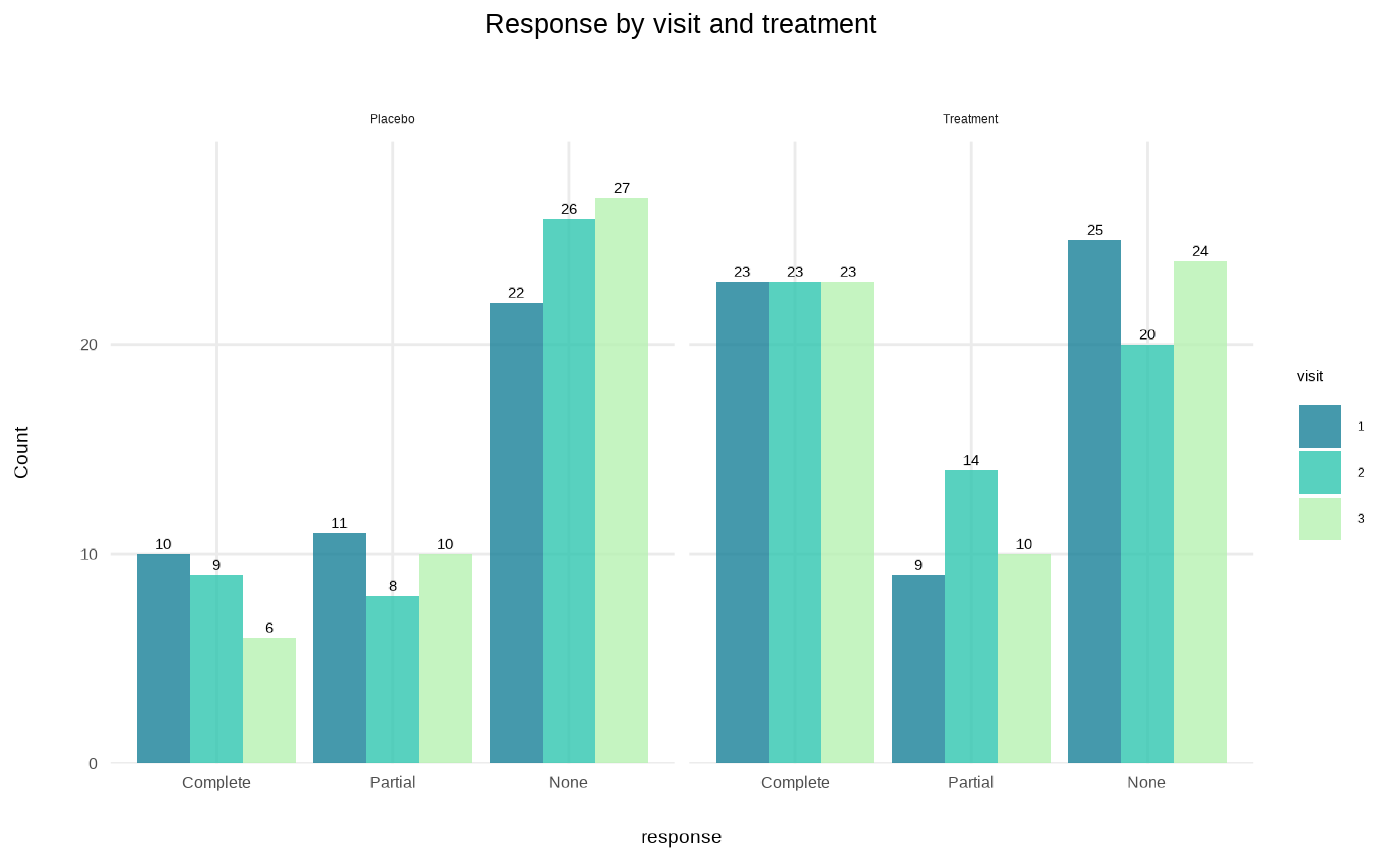
 # Grouped barplot of categorical variable by treatment with value labels
plot_bar(data = clinical_df, x = "response", group = "visit", facet = "treatment",
title = "Response by visit and treatment",values = TRUE)
# Grouped barplot of categorical variable by treatment with value labels
plot_bar(data = clinical_df, x = "response", group = "visit", facet = "treatment",
title = "Response by visit and treatment",values = TRUE)