Generates publication-ready boxplots with optional jittered points and mean overlay.
Usage
plot_box(
  data,
  x,
  y,
  group = NULL,
  facet = NULL,
  colors = NULL,
  title = NULL,
  xlab = NULL,
  ylab = NULL,
  legend_title = NULL,
  points = FALSE,
  point_size = 2,
  y_limits = NULL,
  show_mean = TRUE
)
Arguments
- data
A dataframe containing the variables to plot.
- x
Character string specifying the x-axis variable.
- y
Character string specifying the y-axis variable.
- group
Character string specifying grouping variable for fill/color. Default: NULL.
- facet
Character string specifying faceting variable. Default: NULL.
- colors
Character vector of colors. If NULL, uses TealGrn palette. Default: NULL.
- title
Character string for plot title. Default: NULL.
- xlab
Character string for x-axis label. Default: NULL.
- ylab
Character string for y-axis label. Default: NULL.
- legend_title
Character string for legend title. Default: NULL.
- points
Logical parameter indicating if jittered points. Default: FALSE.
- point_size
Numeric value indicating the size of points. Default: 2.
- y_limits
Numeric vector of length 2 for y-axis limits. Default: NULL.
- show_mean
Logical parameter indicating if mean should be shown. Default: TRUE.
Examples
#Simulated clinical data
clinical_df <- clinical_data(visits = 10)
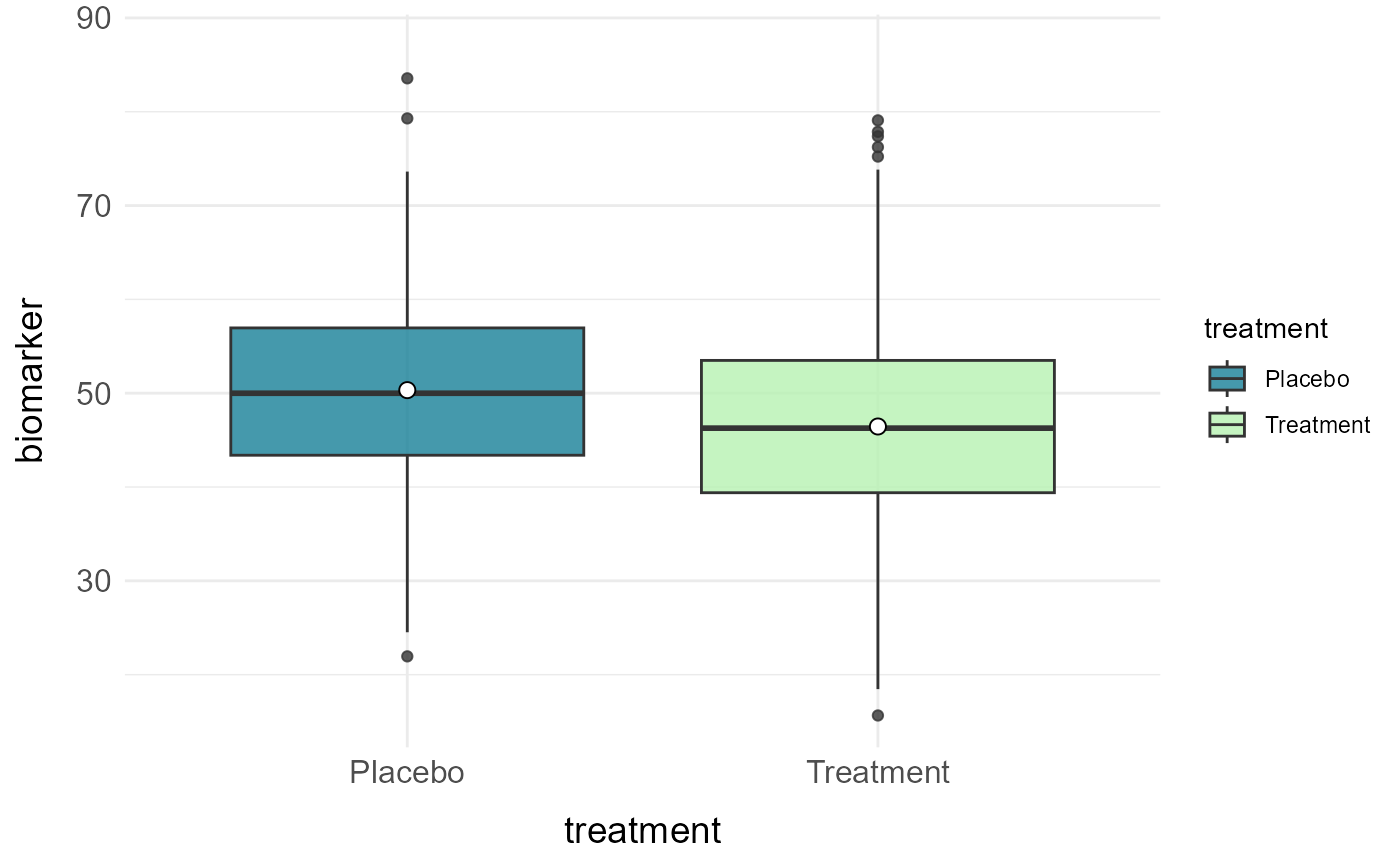
# Boxplot of biomarker by treatment
plot_box(clinical_df, x = "treatment", y = "biomarker", group = "treatment")
#> Ignoring unknown labels:
#> • colour : "treatment"
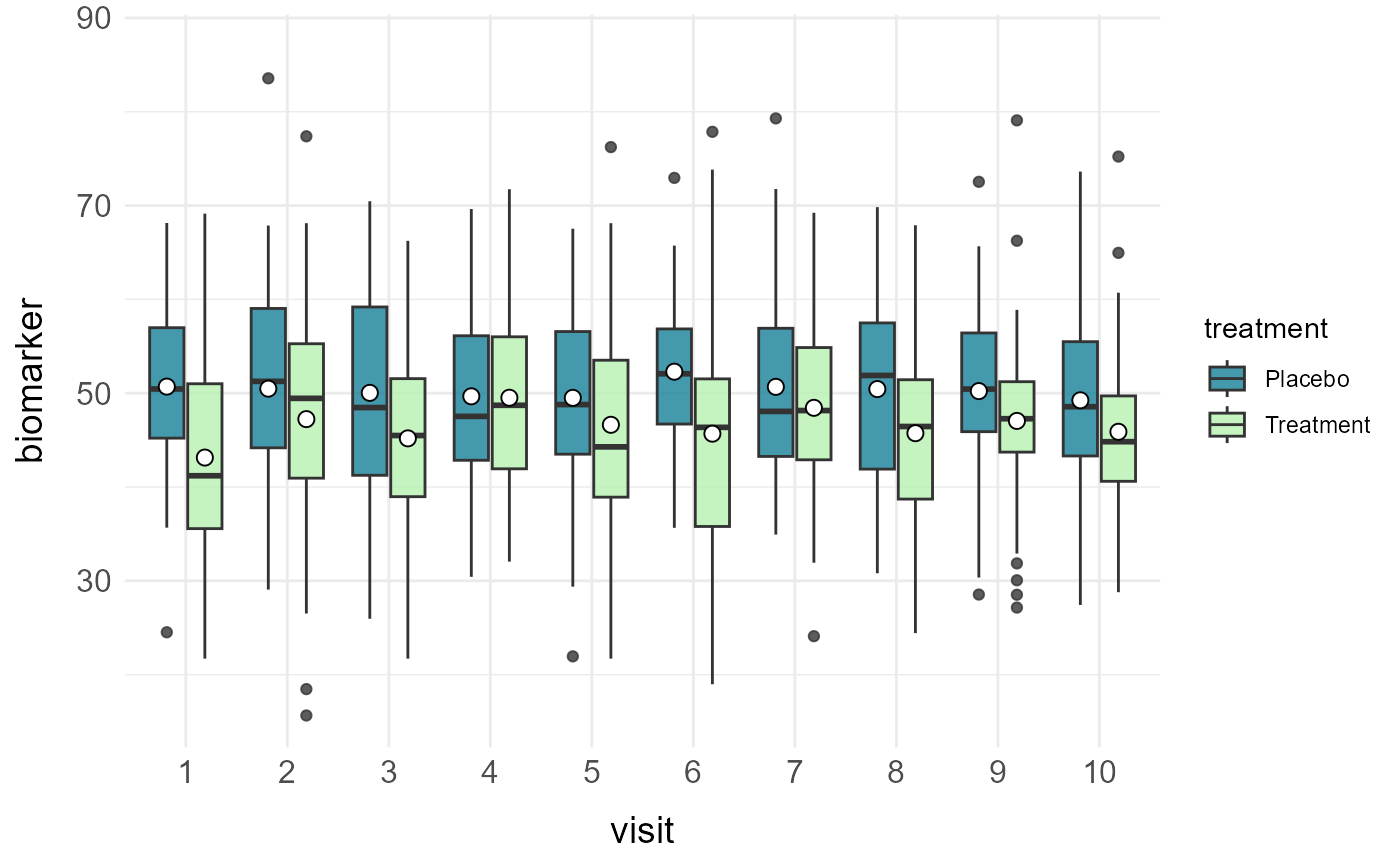
 # Barplot of bimarker by study visit and treatment
plot_box(clinical_df, x = "visit", y = "biomarker", group = "treatment")
#> Ignoring unknown labels:
#> • colour : "treatment"
# Barplot of bimarker by study visit and treatment
plot_box(clinical_df, x = "visit", y = "biomarker", group = "treatment")
#> Ignoring unknown labels:
#> • colour : "treatment"