Generates publication-ready line plots with minimal code using ggplot2.
Usage
plot_line(
  data,
  x,
  y,
  group = NULL,
  facet = NULL,
  stat = NULL,
  error = "se",
  error_width = 0.2,
  colors = NULL,
  title = NULL,
  xlab = NULL,
  ylab = NULL,
  legend_title = NULL,
  points = TRUE,
  line_size = 1,
  point_size = 3,
  y_limits = NULL,
  x_limits = NULL
)
Arguments
- data
A data frame containing the variables to plot.
- x
Character string specifying the x-axis variable.
- y
Character string specifying the y-axis variable.
- group
Character string specifying the grouping variable for multiple lines. Default: NULL.
- facet
Character string specifying the faceting variable. Default: NULL.
- stat
Character string for statistical aggregation: "mean" or "median".
- error
Character string for error bars: "se", "sd", "ci", or "none". Default: "se".
- error_width
Numeric value indicating the width of error bar caps. Default: 0.2.
- colors
Character vector of colors. If NULL, uses TealGrn palette. Default: NULL.
- title
Character string for plot title. Default: NULL.
- xlab
Character string for x-axis label. Default: NULL.
- ylab
Character string for y-axis label. Default: NULL.
- legend_title
Character string for legend title. Default: NULL.
- points
Logical parameter indicating whether to add points to lines. Default: TRUE.
- line_size
Numeric value indicating thickness of lines. Default: 1.
- point_size
Numeric value indicating size of points if shown. Default: 3.
- y_limits
Numeric vector of length 2 for y-axis limits. Default: NULL.
- x_limits
Numeric vector of length 2 for x-axis limits. Default: NULL.
Examples
# Simulated clinical data
clinical_df <- clinical_data(arms = c("A","B","C"), visits = 10)
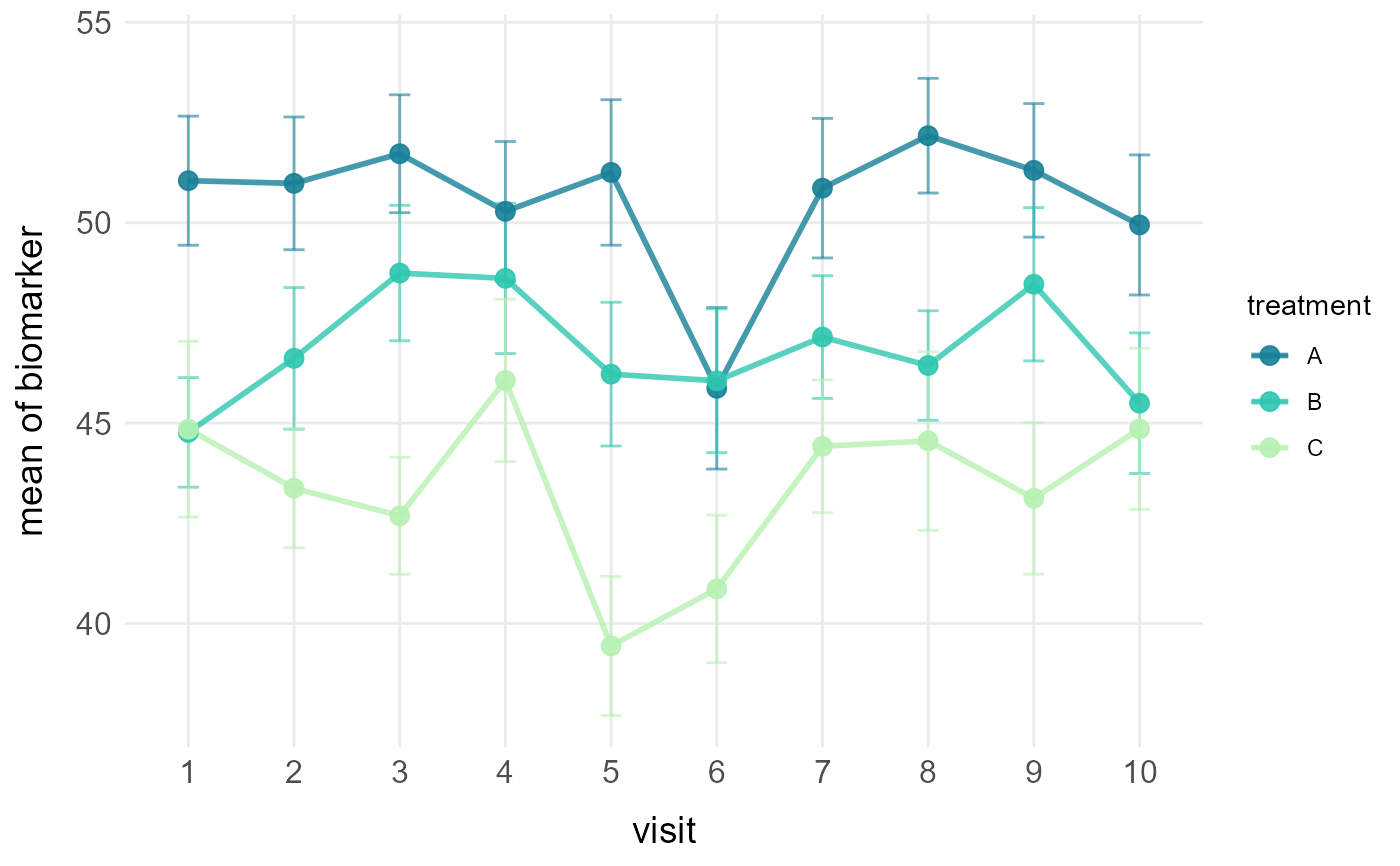
# Line plot with mean and standard error by treatment
plot_line(clinical_df, x = "visit", y = "biomarker",
group = "treatment", stat = "mean", error = "se")
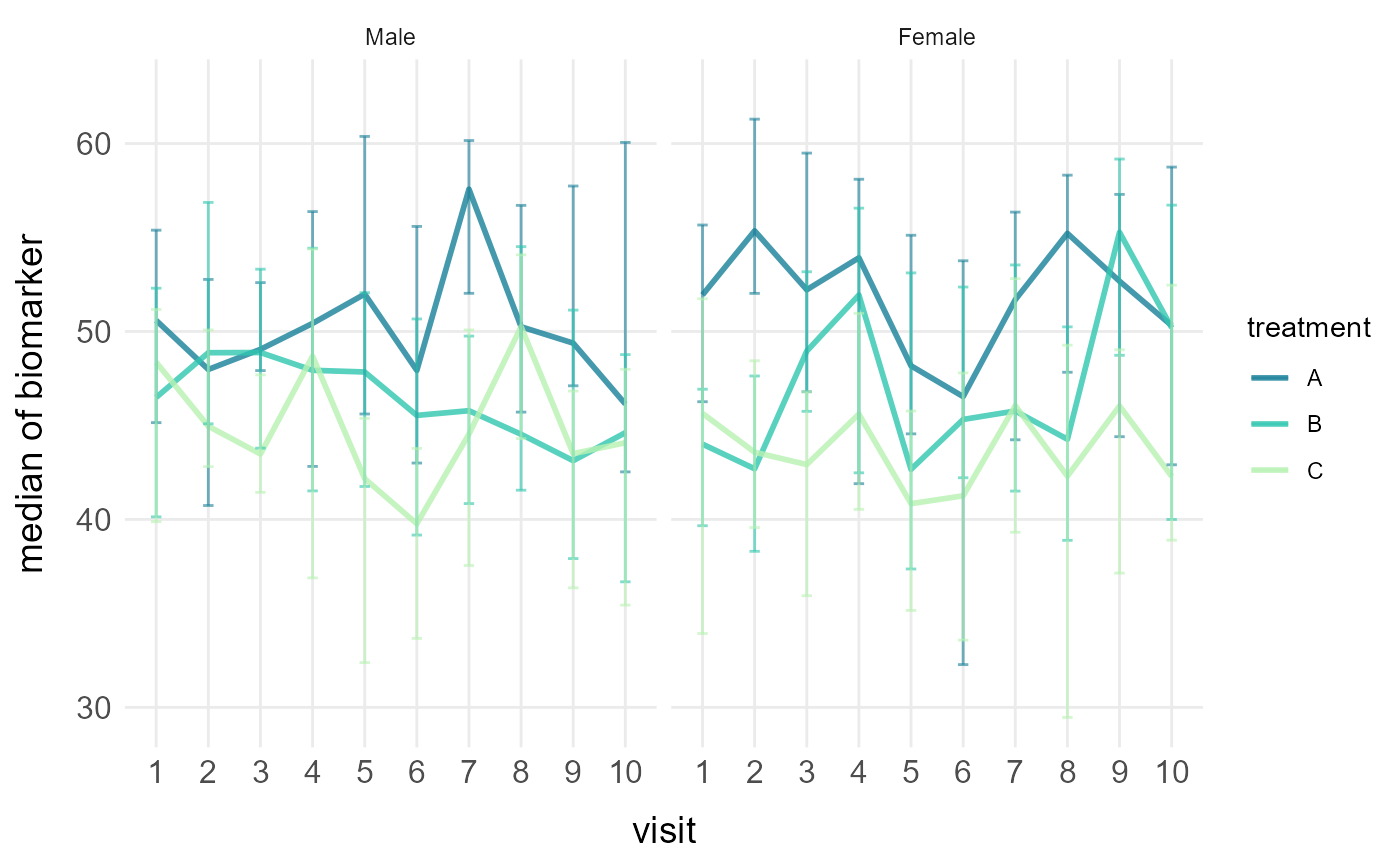
 # Faceted line plots with median and 95% CI
plot_line(clinical_df, x = "visit", y = "biomarker", group = "treatment",
facet = "sex", stat = "median", error = "ci", points = FALSE)
# Faceted line plots with median and 95% CI
plot_line(clinical_df, x = "visit", y = "biomarker", group = "treatment",
facet = "sex", stat = "median", error = "ci", points = FALSE)